Last week Gartner published the updated version of its Magic Quadrant for Business Intelligence and Analytics Platforms, and I need to say that there has been a lot of movement in both directions, up as well as down. There has been a lot of reshuffling especially in the Visionaries quadrant.
This can partly be attributed to a changing market that caused Gartner to combine a few of last year’s assessment criteria as well as adding two more critical criteria as below:
Critical Capabilities Dropped or Changed:
- Combined BI Platform Administration with Security and User Administration
- Modified Data Source Connectivity to Data Source Connectivity and Ingestion
- Combined Publish Analytics Content and Collaboration and Social BI to Publish, Share and Collaborate on Analytic Content
- Added Visual Appeal to Ease of Use
Capabilities Added:
- Smart Data Discovery
- Platform Capabilities Workflow Integration
Smart Data Discovery emphasizes the increasing importance of AI and machine learning as part of analytics systems. Gartner defines it around the automatically “finding, visualizing and narrating of important findings such as correlations, exceptions, clusters, links and predictions in data that are relevant to users without requiring them to build models or write algorithms. Users explore data via visualizations, natural-language-generated narration, search and natural-language query technologies”.
Workflow Integration acknowledges that there is no actionable insight if there is a standalone analytics system. It is defined around the number of products “needed to deliver the critical capabilities and the degree of seamless integration and workflow between capabilities/components”. This has been true for a long time, but hey, better late than never.
Gartner itself states that the changes have been major and that therefor one should not do a year-over-year comparison. Still I will venture into this territory, suspecting that the two additions favor bigger vendors.
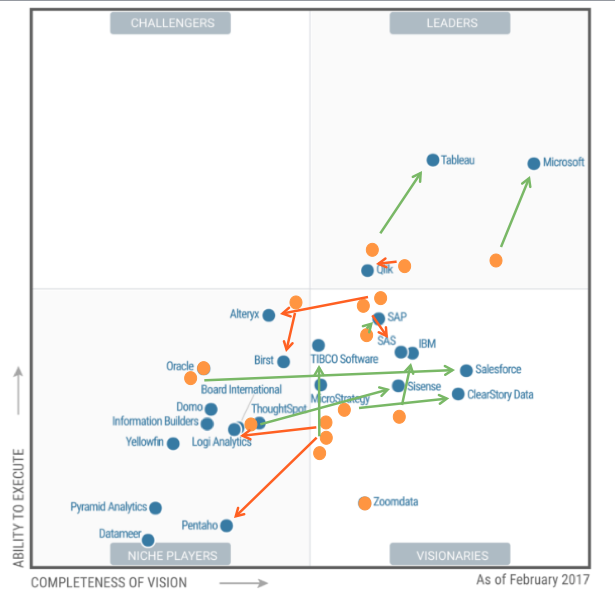
Notable changes to last year’s quadrant include
- A drastic advancement of Microsoft and Tableau making them, especially Microsoft, the undisputed leaders of the pack
- Salesforce and Sisense jumped big time from the Niche Players into the Visionaries quadrant
- Clearstory Data moved up in terms of Completeness of Vision while TIBCO Software and IBM moved up on the Ability to Execute axis
- Alteryx, Pentaho and Logi Analytics dropped off the Visionaries quadrant and became Niche Players
- With Zoomdata we see a new player in the Visionaries Quadrant
- We are welcoming Oracle back in the Quadrant as a Niche Player
There has been a little movement up or down for SAP (slightly up on either axis), SAS (slightly up on vision but down on execution), Qlik (slightly down on vision, marginally down on execution)
In a bit more detail, focusing on movements in the leaders and Visionaries quadrant.
Microsoft
Microsoft offers a clear and visionary roadmap, underpinned by monthly delivery to it, on an already very strong product that is powered by Azure. For on premise usage there is the Power BI Desktop solution. However, the strong focus on cloud (which I think is right) along with still some lacking functionality hampers the execution score. This is something that a development powerhouse like Microsoft should be able to address. Consequent execution on their roadmap along with a continued price war should make them a formidable competitor for Tableau, which Microsoft is likely to surpass in the coming year.
Tableau
Tableau is in some sense the gold standard of analytics. The software is very interactive and intuitive and got enriched by lots of Enterprise functionality, likely in an attempt to fend off Microsoft. As a caution Gartner mentions that these new functionalities appear to be work in progress. Tableau appears to be in a challenging position with the need of redefining their differentiators (interactivity and inductivity are degrading as differentiators) and the parallel need to invest into more up-and-coming functionalities like smart data discovery. Compared to Microsoft Tableau is also expensive. This year will show how Tableau manages this tight spot.
Qlik
Qlik has a sound and robust set of product but seems to have a challenge supporting them all. The company being taken private customers seem to have a bit of concern regarding the stability of the roadmap, which so far seems to be unjustified. The main issue that Gartner sees with Qlik is a lacking investment into smart data discovery, thus the downgrade in vision.
Salesforce
Salesforce jumped far into the Visionaries quadrant because of the combination of AI enabled analytics (Einstein), interactive visualizations (Wave) and the purchase of smart data discovery startup BeyondCore (which consequently vanished from the quadrant). Salesforce seems to concentrate on their installed base when marketing and selling their Analytics Cloud. Deeper integration of above mentioned functionalities in combination with increased marketing and sales to new customers could move Salesforce into the Leaders quadrant.
Clearstory Data
Clearstory Data has been in the Visionary quadrant last year and moved strongly on the vision scale this year. This is largely due to a strong understanding of their market, ease of use, the ability to do complex analytics and a roadmap that focuses on the right things (smart data discovery). Clearstory will need to work on their being fairly unknown in order to enjoy continued success.
IBM
IBM got propelled up on the execution scale by the strong market presence of Watson that delivers on AI driven, machine learning, analytics capabilities and smart data discovery – ticking all the boxes. IBM’s ‘problem’ is that they also have Cognos Analytics, which somewhat jumbles the vision. Further, IBM surprisingly seems to have a challenge with higher data volumes.
Sisense
Sisense moved up from the Niche Players into the Visionaries due to a strong focus on smart data discovery and embracing innovative technologies like voice query and offering ‘analytics bots’. Being a young company they lack some advanced capabilities. They also cannot yet show big deployments.
TIBCO Software
TIBCO Software renewed their focus on critical parts of analytics software, notably smart data discovery, albeit they are not yet ‘cloud’ enough. The renewed focus along with more emphasis on customer engagement helped them up on the execution scale.
Zoomdata
Zoomdata debuts in this quadrant based upon their strong focus on stream analytics. They are strong in these areas, embed well but lack functionality and customer engagement (and customers). They also still need to prove their ability to support big numbers of users.
But wait, that cannot be all!
What about other powerhouses like SAS, SAP, and Oracle?
Well, Oracle is back on the map after refreshing their analytics offering. Oracle has gained traction and with a roadmap that includes machine learning, smart data discovery and NLP stands a chance of moving up to the Visionaries quadrant next year.
SAP is virtually unmoved, slightly up on both scales probably. The analytics offering seems to have good momentum and the roadmap is geared into the right direction. The company’s main challenge continues to be support and the complexity of SAP product, both being actively targeted.
This leaves us with SAS. While SAS has one of the strongest functional footprints and strong integration. Similar to SAP, SAS hurts itself in cost, ease of use and ease of making business with. On top of this there seems to be confusion about the different product lines SAS offers. As with SAP none of these challenges should be insurmountable.